Understanding local chemistry in cross-sectioned lithium-ion battery cathode through secondary electron hyperspectral imaging
- Abstract number
- 120
- Presentation Form
- Poster & Flash Talk
- DOI
- 10.22443/rms.mmc2023.120
- Corresponding Email
- [email protected]
- Session
- Poster Session Two
- Authors
- James F. Nohl (2, 5), Gareth M. Hughes (1), Stuart Robertson (3), Yige Sun (5, 6, 7), Stuart Micklethwaite (4), Nicole Hondow (4), Mark Jepson (3), Serena Cussen (2, 5), Cornelia Rodenburg (2)
- Affiliations
-
1. David Cockayne Centre for Electron Microscopy, Department of Materials, University of Oxford, Parks Road
2. Department of Materials Science and Engineering, The University of Sheffield, Mappin Street
3. Department of Materials, Loughborough University
4. Leeds Electron Microscopy and Spectroscopy Centre, School of Chemical and Process Engineering and the Bragg Centre for Materials Research, University of Leeds
5. The Faraday Institution, Quad One, Harwell Science and Innovation Campus
6. Department of Materials, University of Oxford, Parks Road
7. Linacre College, University of Oxford, St. Cross Road
- Keywords
Lithium-ion battery cathode
High-nickel cathode material
Scanning electron microscope (SEM)
Secondary electron hyperspectral imaging (SEHI)
Non-negative matrix factorisation (NNMF)
Surface sensitive chemical analysis
- Abstract text
Summary
Secondary electron hyperspectral imaging (SEHI) analysis is sensitive to lithium compounds, a class of materials not yet analysed by scanning electron microscope (SEM) -derived secondary electron (SE) spectroscopy.
Li2CO3 was related to primary particle boundaries ~60 nm wide in a high-nickel cathode active material (CAM). Analysis of light elements in SEM using X-ray and backscatter electron emissions is not possible at the surface and at this length scale.
Introduction
SEHI has been useful for understanding the surface chemistry of functional carbon materials [1]. SEM-derived SE spectra of single elements have been related to the valence band density of states (DOS) [2]. Could SEHI in SEMs with energy filtering capability be applied to the analysis of complex oxide materials from the cathode of the lithium-ion battery (LIB)?
High-nickel content CAMs in the LiNi1-x-yMnxCoyO2 (NMC) family have been developed to reduce cobalt content and increase charge capacity. The particle morphology of polycrystalline NMC is a key determinant in CAM performance. At the level of NMC primary particles, degradation mechanisms such as particle cracking, transition metal dissolution and lithium trapping have been reported to severely limit the application stability of these materials [3].
To observe these particle degradation mechanisms, focused ion beam (FIB) SEMs are used to prepare and observe particle morphology in cross-section and to measure the extent and location of these degradation mechanisms. For example, the increase of trapped lithium at NMC811 primary particle boundaries after storage in air versus inert storage conditions was tracked with FIB-SEM and secondary ion mass spectrometry (SIMS) tuned for detection of lithium [4].
However, SIMS is not commonly available versus energy filtering of SEs and SEHI can provide complimentary chemical bonding information. Here we show that the secondary electron hyperspectral imaging (SEHI) in FIB-SEMs can be used to visualise the distribution of chemistry in the cross-section cathode materials.
Alternative methods for creating cathode cross-sections were also explored – as local chemical reactions caused by ion beam heating can alter the material under investigation [5].
Methods/Materials
The Helios G4 PFIB Cxe (ThemoFisher Scientific) PFIB was used to cross-section NMC811 (PI-KEM) cathodes (90:5:5 NMC811:CB (carbon black):PVDF (polyvinylidene fluoride)) made by slurry casting. A 3D-printed pin-stub with a pre-tilt angle of 36° was printed by a conventional Fused Filament Fabrication 3D printer to aid the air-sensitive workflow and present the cross-section surface normal to the SEM beam. The cryofractured NMC811 electrode was made by slurry casting. The Leica ultramicrotome cross-sectioned NMC811 (PI-KEM) embedded in epoxy resin mixed with CB. Li2CO3 and LiOH·H2O powders were prepared by embedding in Field’s metal as in [6]. The Helios SEM with Elstar column was used to collect SEHI data volumes from CAM, Li2CO3 and LiOH·H2O. Non-negative matrix (NNMF) factorisation was used to perform blind source-separation of particle segmented SEHI data volumes.
Results and Discussion
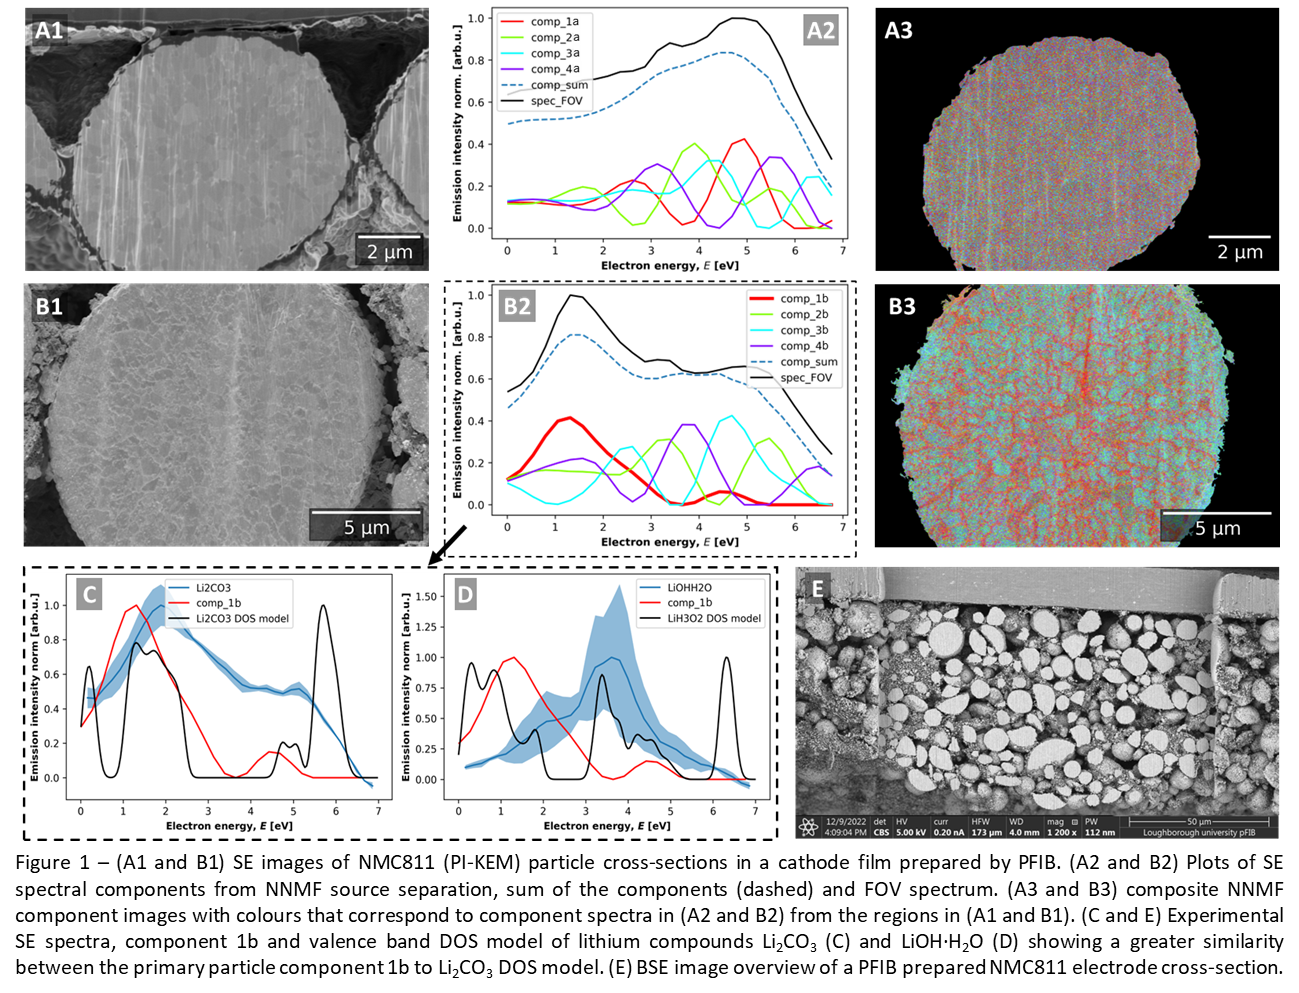
Two NMC811 particle cross-section morphologies were observed after sectioning with PFIB: (i) a typical particle, where primary particle boundaries are visible due to contrast between primary particles (Figure 1A1); (ii) where primary particle boundaries appear bright and have strong contrast to primary particles (Figure 1 A2).
To investigate the chemical components present in the cross-sectioned surface, NNMF component analysis was performed to separate the SEHI data volume, providing component SE spectra (Figure 1 A2 and B2) and component maps (Figure 1 A3 and B3) which reflect surface chemistry. The component map from particle (i) indicates a homogenous surface chemistry at the primary particle scale (Figure 1 A3), while NNMF identified a component 1b (Figure 1 B2) localised to the primary particle boundary morphology (coloured red in the NNMF component colour image, Figure 1 B3). Meanwhile, particle (ii) components 2b and 3b (Figure 1 B2) associated with the primary particles more closely match particle (i) components 4a and 1a (in Figure 1 A2).
To establish the origin for the contrast at primary particle boundaries, component 1b was compared to experimental SE spectra and valence band DOS models of Li2CO3 (Figure 1C) and LiOH·H2O (Figure 1D), which could be trapped lithium compounds from calcination with lithium salts during synthesis [7], or formed during storage [4]. The comparison indicates that the particle (ii) primary particle boundary morphology more closely matches the experimental spectrum and DOS model of Li2CO3, and not LiOH·H2O. Finally, large area cross-sections make particles accessible through the electrode thickness (Figure 1E).
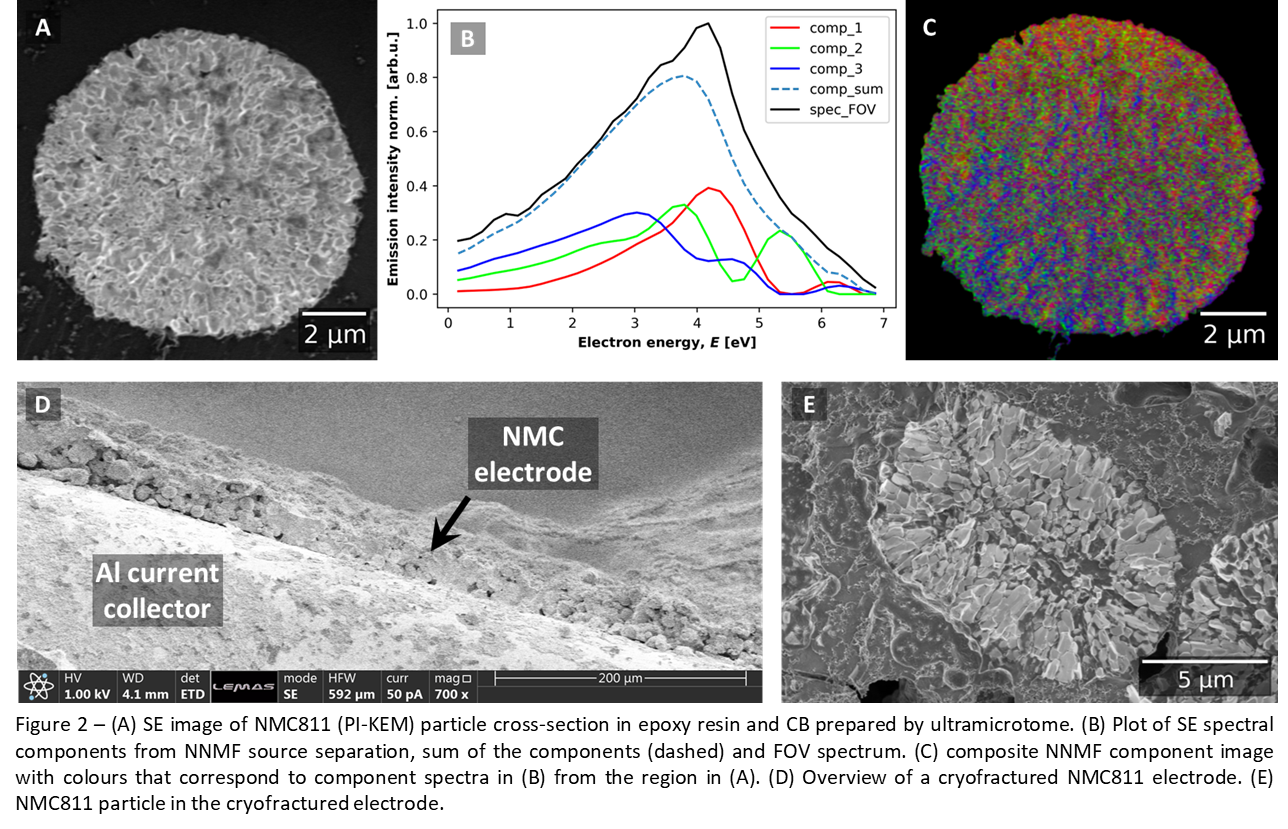
The ultramicrotome (Figure 2A-C) method was also used to prepare NMC811 particle cross-sections. The epoxy embedded NMC811 particle (Figure 2A) derived spectrum (Figure 2B, spec_FOV) is different to the two PFIB prepared sections indicating the influence of preparation method on surface chemistry. The component spectra are not understood, but the FOV spectrum shape indicates amorphous carbon chemistry [1], which could be resin which is dragged across the material by the blade.
Finally, cryofractured cathode is shown in Figure 2D, along with a cross-section particle from the cryofractured cathode Figure 2E.
Conclusion
SEHI analysis has proved sensitive to lithium compounds, a class of materials not yet analysed by SEM-derived spectroscopy.
A primary particle boundary chemistry present within a pristine NMC811 particle prepared by PFIB was related to Li2CO3 but was not identified in ultra-microtome prepared cross-sections. The variation of results within particles prepared by the same method in combination with variations between cross-section preparation methods calls for analysis of a large number of particles with a minimum of surface alteration because of the extreme surface sensitivity of SEHI. Cryofracture could offer a means to verify surface preparation by PFIB. Future work should collect reference spectra from other likely trapped lithium compounds such as LiHCO4 and LiOH to enable wider identification and localisation of trapped lithium and inform synthesis, storage and degradation of high-nickel CAM.
Acknowledgement
This work was funded by the Faraday Institution FutureCat Project (FIRG017) and SEE MORE MAKE MORE (EP/V012126/1) and supported by the Henry Royce Institute (EP/R010145/1). JFN acknowledges the Faraday Institution studentship (FIRG017). YS thanks NEXTRODE Project (FIRG015).
- References
- K. J. Abrams, et al., Adv. Sci. 2019, Volume 6, 1900719, https://doi.org/10.1002/advs.201900719
- W. Han, et al., Sci Rep, 2020, Volume 10, 22144, https://doi.org/10.1038/s41598-020-78973-0
- Xiaopeng Cheng, et al., ACS Energy Letters 2021, Volume 6 (5), 1703-1710, https://doi.org/10.1021/acsenergylett.1c00279
- Chiara Busà, et al., Electrochimica Acta 2021, Volume 366, 137358, https://doi.org/10.1016/j.electacta.2020.137358
- Lis G.de A. Melo, et al., Journal of Power Sources, 2016, Volume 312, 23-35, https://doi.org/10.1016/j.jpowsour.2016.02.019
- James F. Nohl, et al., Micron, 2022, Volume 156, 103234, https://doi.org/10.1016/j.micron.2022.103234
- H. Ronduda, et al., Nanomaterials, 2020, Volume 10 (10), 2018, https://doi.org/10.3390/nano10102018