Improving the Precision of 4D-STEM Orientation Mapping by the Quantitative Analysis of Precession Electron Diffraction Intensities
- Abstract number
- 214
- Presentation Form
- Poster & Flash Talk
- DOI
- 10.22443/rms.mmc2023.214
- Corresponding Email
- [email protected]
- Session
- Poster Session One
- Authors
- Msc Leonardo Corrêa (2), Dr. Eduardo Ortega (1), Prof. Arturo Ponce (1), Prof. Mônica Cotta (2), Prof. Daniel Ugarte (2)
- Affiliations
-
1. Department of Physics and Astronomy, UTSA
2. Instituto de Física "Gleb Wataghin", UNICAMP
- Keywords
4D-STEM
Advanced EM
Diffraction Studies
Advanced Data Processing
Low-dimensional materials
Nanomaterials
- Abstract text
At present, 4D-STEM data brings new opportunity to perform the structural characterization of a diverse range of materials (metals, molecular solids, ferroelectrics, perovskites, etc.). Surprisingly, many 4D-STEM data analysis only exploits diffraction spot positions and neglect beam intensities. In this work, we will describe the developing of a methodology to perform automatic crystal orientation measurement (ACOM) by the quantitative analysis of precession electron diffraction (PED) intensities (a processing analogous to structure refinement with x-ray diffraction).1 This was applied in Eshelby twisted InP nanowires (hexagonal wurtzite structure, ~ 48 nm in diameter) containing an axial screw dislocation (Figure 1). The dislocation generates helicoidal atomic planes, where the basal plane normal shows different tilts across the NW center (Figure 1a). The PED patterns were acquired on a JEOL 2010F microscope (200 kV) equipped with TVIPS F416 CMOS detector (2048 x 2048 pixels, 16-bit range). We have used a Nanomegas precession control unit (precession angle 8.8 mrad) and a beam convergence of 1.84 mrad (probe diameter of 5 – 8 nm). The entire data treatment procedure was performed by a home-made software developed in Python. Simulations were performed with a two-beam dynamical approximation combined with the complete description of the PED diffraction geometry provided by Gjonnes.2 We performed quantitative comparison of PED intensities from measurement and simulations, where conventional crystallography residue metric were used for optimizing the crystal orientation angles. Residues remained below 20% what is considered a good value in previous reports of structure refinement using this approach (see Figure 2). The procedure easily detected the dislocation core (see Figure 2) with a precision much smaller (~0.1x) than the pattern-matching one usually limited to ~1º.4 Further improvements are possible both in angular precision and spatial resolution with use of modern direct detection cameras and aberration correctors that will allow higher precession angles during 4D-STEM acquisition.
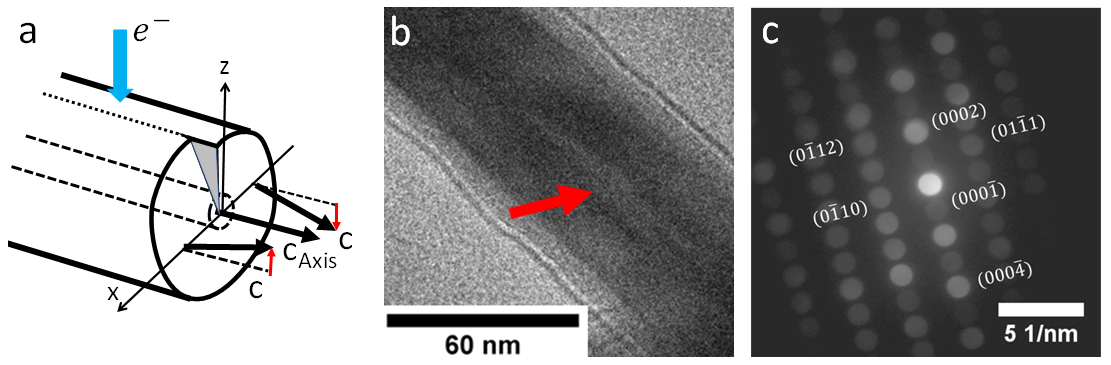
Figure 1: a) Effect of screw dislocation on the orientation of hexagonal axis at both sides of the core. b) BF-TEM image of the Eshelby twisted wurtzite InP nanowires; note the image contrast at the wire axis due to the dislocation. c) typical PED pattern measured approximately along the [2-1-10] zone axis; note the occurrence of weak kinematically forbidden diffraction spots.
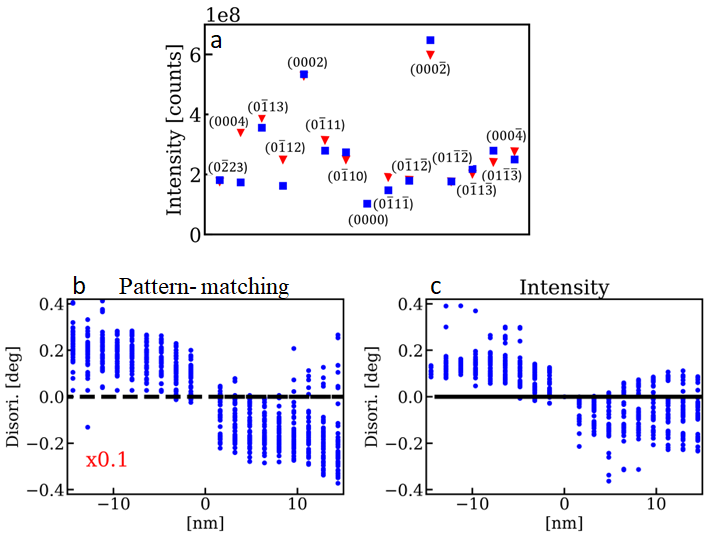
Figure 2: a) Example of a comparison between measured (triangles) and simulated (square) PED diffraction spots. Comparison of the c-axis disorientation (in relation to the NW center) across the NW center: b) pattern-matching results and (c) PED intensity analysis. Note that the pattern-matching value have been rescaled downwards by a factor 10x to allow a direct graphical comparison.
- References
(1) P. A. Midgley et al., IUCrJ ,2 126–136 (2015).
(2) K. Gjonnes, Ultramicroscopy, 69 1–11 (1997); P. Oleynikov et al., Ultramicroscopy, 107 523–533 (2007).
(3) L. Palatinus et al., Acta Crystallogr. B Struct. Sci. Cryst. Eng. Mater., 71 740–751 (2015).
(4) N. Cautaerts et al., Ultramicroscopy, 237 113517 – 113527 (2022); E. F. Rauch et al. Z. Kristallogr. Cryst. Mater., 225 103-109 (2010); C. Ophus et al. Microsc. Microanal., 28 390 – 403 (2022); I. MacLaren et al., Microsc. Microanal. 26, 1110–1116 (2020); M. Nord et al. Microsc. Microanal., 26 653-666 (2020); J. Jeong et al. Microsc. Microanal., 27 1102-1112 (2021).
(5) This research was supported by CNPq, CAPES and FAPESP (Brazil) and the Department of Defense (USA).