True 3D Analysis of Human Inner Limiting Membrane Roughness
- Abstract number
- 34
- Presentation Form
- Poster & Flash Talk
- DOI
- 10.22443/rms.mmc2023.34
- Corresponding Email
- [email protected]
- Session
- EMAG - 3D & Tomographic Electron Microscopy
- Authors
- Mr Ross Laws (1), Prof David H Steel (1)
- Affiliations
-
1. Newcastle University
- Keywords
Serial block face scanning electron microscopySBF-SEM, SBEM, Internal limiting membrane, inner limiting membrane, ILM, volume electron microscopy, image analysis, bioimage analysis, bioimage informatics.
- Abstract text
Introduction
The internal limiting membrane is the innermost layer of the retina. It is acellular membrane and is the basement membrane of the Müller cells (key retina supporting glial cells). The ILM is peeled during retinal surgery to treat a variety of retinal disorders. Peeling of the ILM however leads to a characteristic postoperative appearance to the inner retina in the peeled area termed a ‘dissociated optic nerve fibre layer’ (DONFL) appearance, with a characteristic pattern. The exact mechanism for this pattern is unknown.
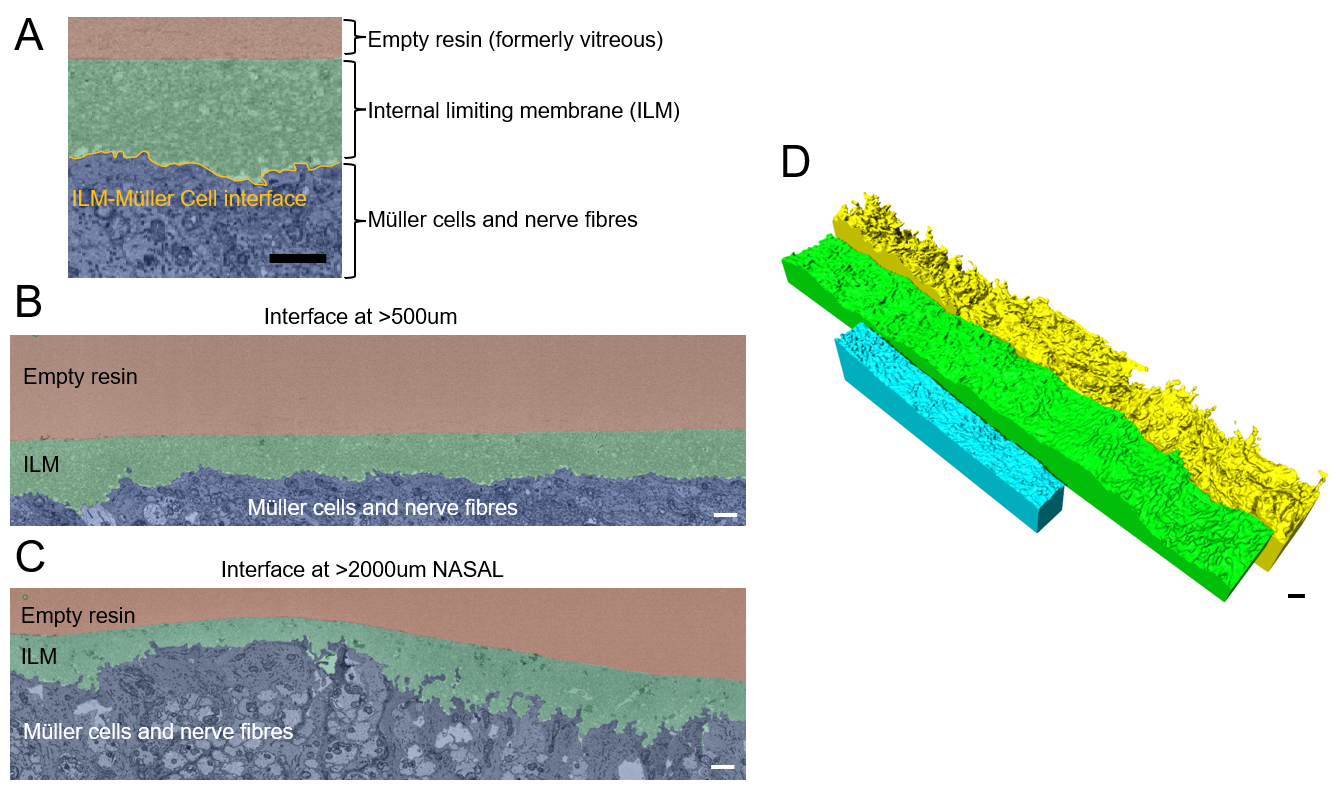
The ILM-Müller cell interface (ILM-MC interface) appears as shown in Figure 2A and is where the ILM and Müller cell membrane meet. Preliminary investigation of the ILM-MC interface (Figure 2A yellow line), using transmission electron microscopy (TEM) and serial block face scanning electron microscopy (SBF-SEM) revealed that it can vary spatially in roughness. We therefore hypothesised this roughness may vary systematically across the retinal surface and cause the characteristic pattern of the DONFL appearance. I developed an bioimage analysis workflow to quantify the roughness off the ILM-MC interface. The aim was to assess if the ILM-MC roughness varied with position across the retina. We chose volume electron microscopy, specifically SBF-SEM to image the ILM-MC interface.
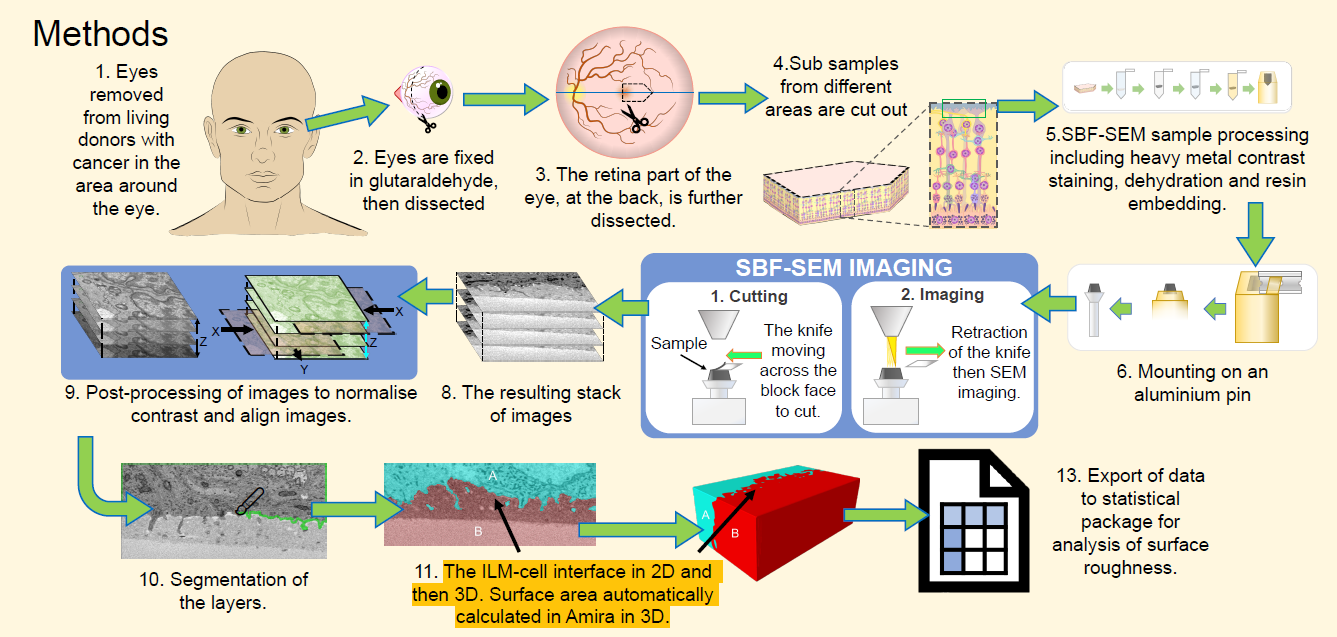
Methods
The method I developed for this involves the following steps:
Figure 1: Method for imaging and quantifying ILM roughness.
Step 7 (Figure 1: SBF-SEM) imaging was performed using a Gatan 3view2 using a Zeiss SigmaVP via Digital Micrograph sofatware (Gatan Inc). Postprocessing and segmentation in step 9&10 (Figure 1) was performed using Microscopy image browser.
For step 11 and 12 in Figure 1 the surface area of the ILM-MC interface was first determined using Amira software and an equation to subtract the unwanted surface are of the model. The surface area of the interface was then compared to the envelope area to calculate SDRprime as the measurement of roughness, as presented by A. Townsend (2019).
Figure 2: A) Layers present in the data and the ILM-MC interface (yellow line). B) The interface at 500um from the fovea vs >2000um from the fovea in C. 3D renderings of the interface, showing the Cell side. Most rough in Yellow moving to least rough in Cyan. All scale bars represent 1um.
Results
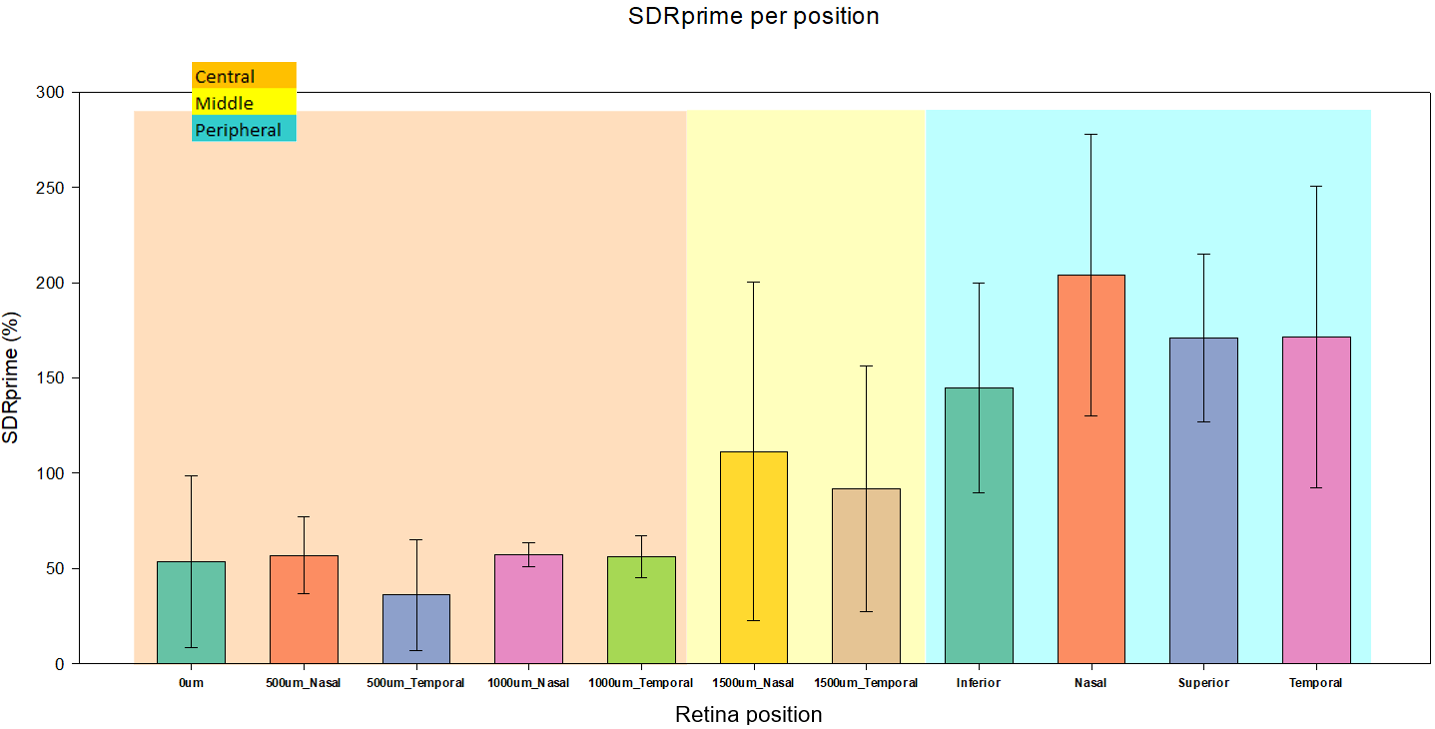
Early data using this workflow indicates that the roughness of the ILM-MC interface varies substantially with respect to the retinal position. A greater frequency and size of cellular projections into the ILM is visible in datasets 1500um and further from the fovea.
Figure 3: Retinal positions measured roughness along with the region they belong to (background colour left to right: Central, Mid and Peri)
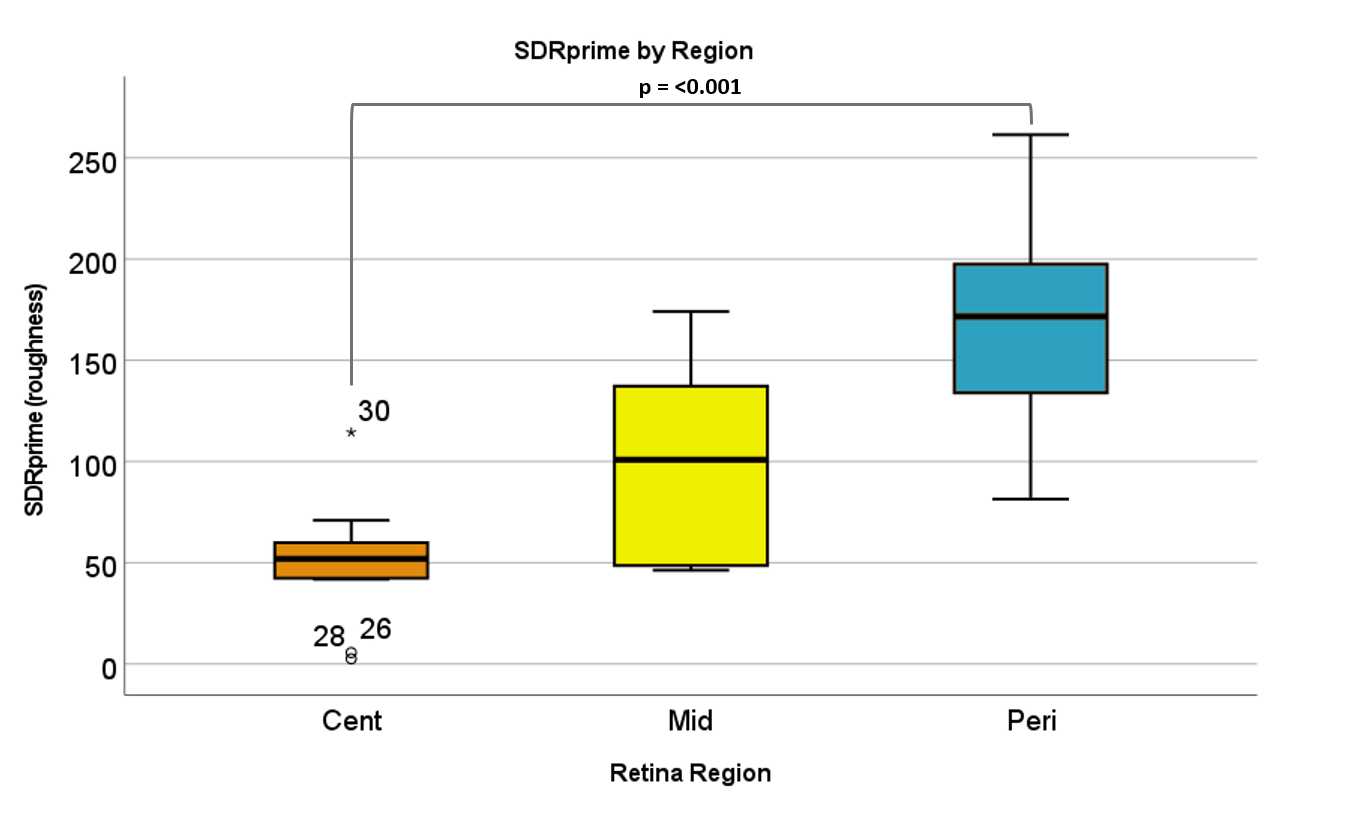
Roughness of 3 distinct regions of the retina was calculated by as the mean roughness of the various measurement positions enclosed within the region; 0um-1000um being the center, 1500um-2000um being middle and >3000 being peripheral (Figure 3). Roughness of the ILM-MC interface appears to increase with distance from the foveal centre (Figure 3) and the statistical analysis supports this with a significant difference between the central (<1500um) and peripheral (>3000) regions of the retina when tested with Kruskal-Wallis One Way Analysis of Variance (n = 11 for each group, p = <0.001). To compare the central samples with the peripheral ones, a sub sample of 11 datapoints was randomly chosen from the original 15 central datapoints.
Figure 4: Graph of roughness aggregated data points within regions of the retina. The roughness in central and peripheral region demonstrated a significant difference (n = 11 for each group, p = <0.001). For each the graph (Cent n=15, Mid n=4 and Peri n=11). Error bars = standard deviation.
Differences between the positions measured were also tested. Of key interest were the aggregated datapoints for 1000um from the fovea and the aggregated datapoints for 1500um. There appeared to be a large increase in roughness (Figure 3) between these zones.
Discussion and Conclusions
The data does show that ILM varies significantly between positions on the retina, however further data points would add validity to our findings.
The current findings correspond with previous data from peeled ILMs imaged using atomic force microscopy (Henrich et al 2012, Candiello et al 2010) that also demonstrated increasing roughness of the cellular side of the ILM with respect to distance from the fovea.
The roughness results will be compared with clinical observations following ILM peeling, with the end goal of statistically correlating roughness with clinical outcomes. ILM thickness and ILM distance to the NFL are also of interest and these factors are currently being analysed.
- References
- P. B. Henrich et al. “Nanoscale topographic and biomechanical studies of the human internal limiting membrane”. In: Invest Ophthalmol Vis Sci 53.6 (2012), pp. 2561–70. ISSN: 0146-0404. DOI: 10.1167/iovs.11-8502.
- J. Candiello, G. J. Cole, and W. Halfter. “Age-dependent changes in the structure, composition and biophysical properties of a human basement membrane”. In: Matrix Biol 29.5 (2010), pp. 402–10. ISSN: 1569-1802 (Electronic) 0945-053X (Linking). DOI: 10.1016/j.matbio.2010.03.004.
- A. Townsend, L. Pagani, P. J. Scott, and L. Blunt. “Introduction of a Surface Characterization Parameter Sdrprime for Analysis of Re-entrant Features”. In: Journal of Nondestructive Evaluation 38.2 (2019), p. 58. ISSN: 1573-4862. DOI: 10.1007/s10921-019-0573-x.