AXON: A Machine-Vision Approach to Transmission Electron Microscopy Workflows, Results Analysis and Data Management
- Abstract number
- 341
- Presentation Form
- Poster
- DOI
- 10.22443/rms.mmc2023.341
- Corresponding Email
- [email protected]
- Session
- Poster Session One
- Authors
- Madeline Dressel Dukes (1), Nynke Krans (1), Katherine Marusak (1), Stamp Walden (1), Yaofeng Guo (1), Tim Eldred (1), John Damiano (1)
- Affiliations
-
1. Protochips, Inc.
- Keywords
In-Situ, Operando TEM, Electron Microscopy, Machine Vision
- Abstract text
The transmission electron microscope (TEM) enables us to observe the smallest of features and has unlocked countless discoveries in both biological and materials applications. Advances in hardware and software capabilities of the TEM have propelled a so-called ”revolution in resolution” within the cryo-TEM community, and utilization of the TEM as a real-time nano-laboratory for in-situ and operando experiments is no longer considered a novelty [1–3].
This rapid growth of output for complex TEM experiments has introduced new considerations and forced users to consider strategies for data collection, management and analysis [4,5]. In-situ and operando workflows require expert alignment of parameters from many sources – both those that control/stimulate the sample’s environment and to measure the resulting behavior or output from the sample. This results in large, complex data sets that must be analyzed holistically, rather than as isolated images. AXON Synchronicity is a machine-vision solution initially conceived to meet these challenges but is equally applicable to data analysis and management for more conventional TEM workflows.
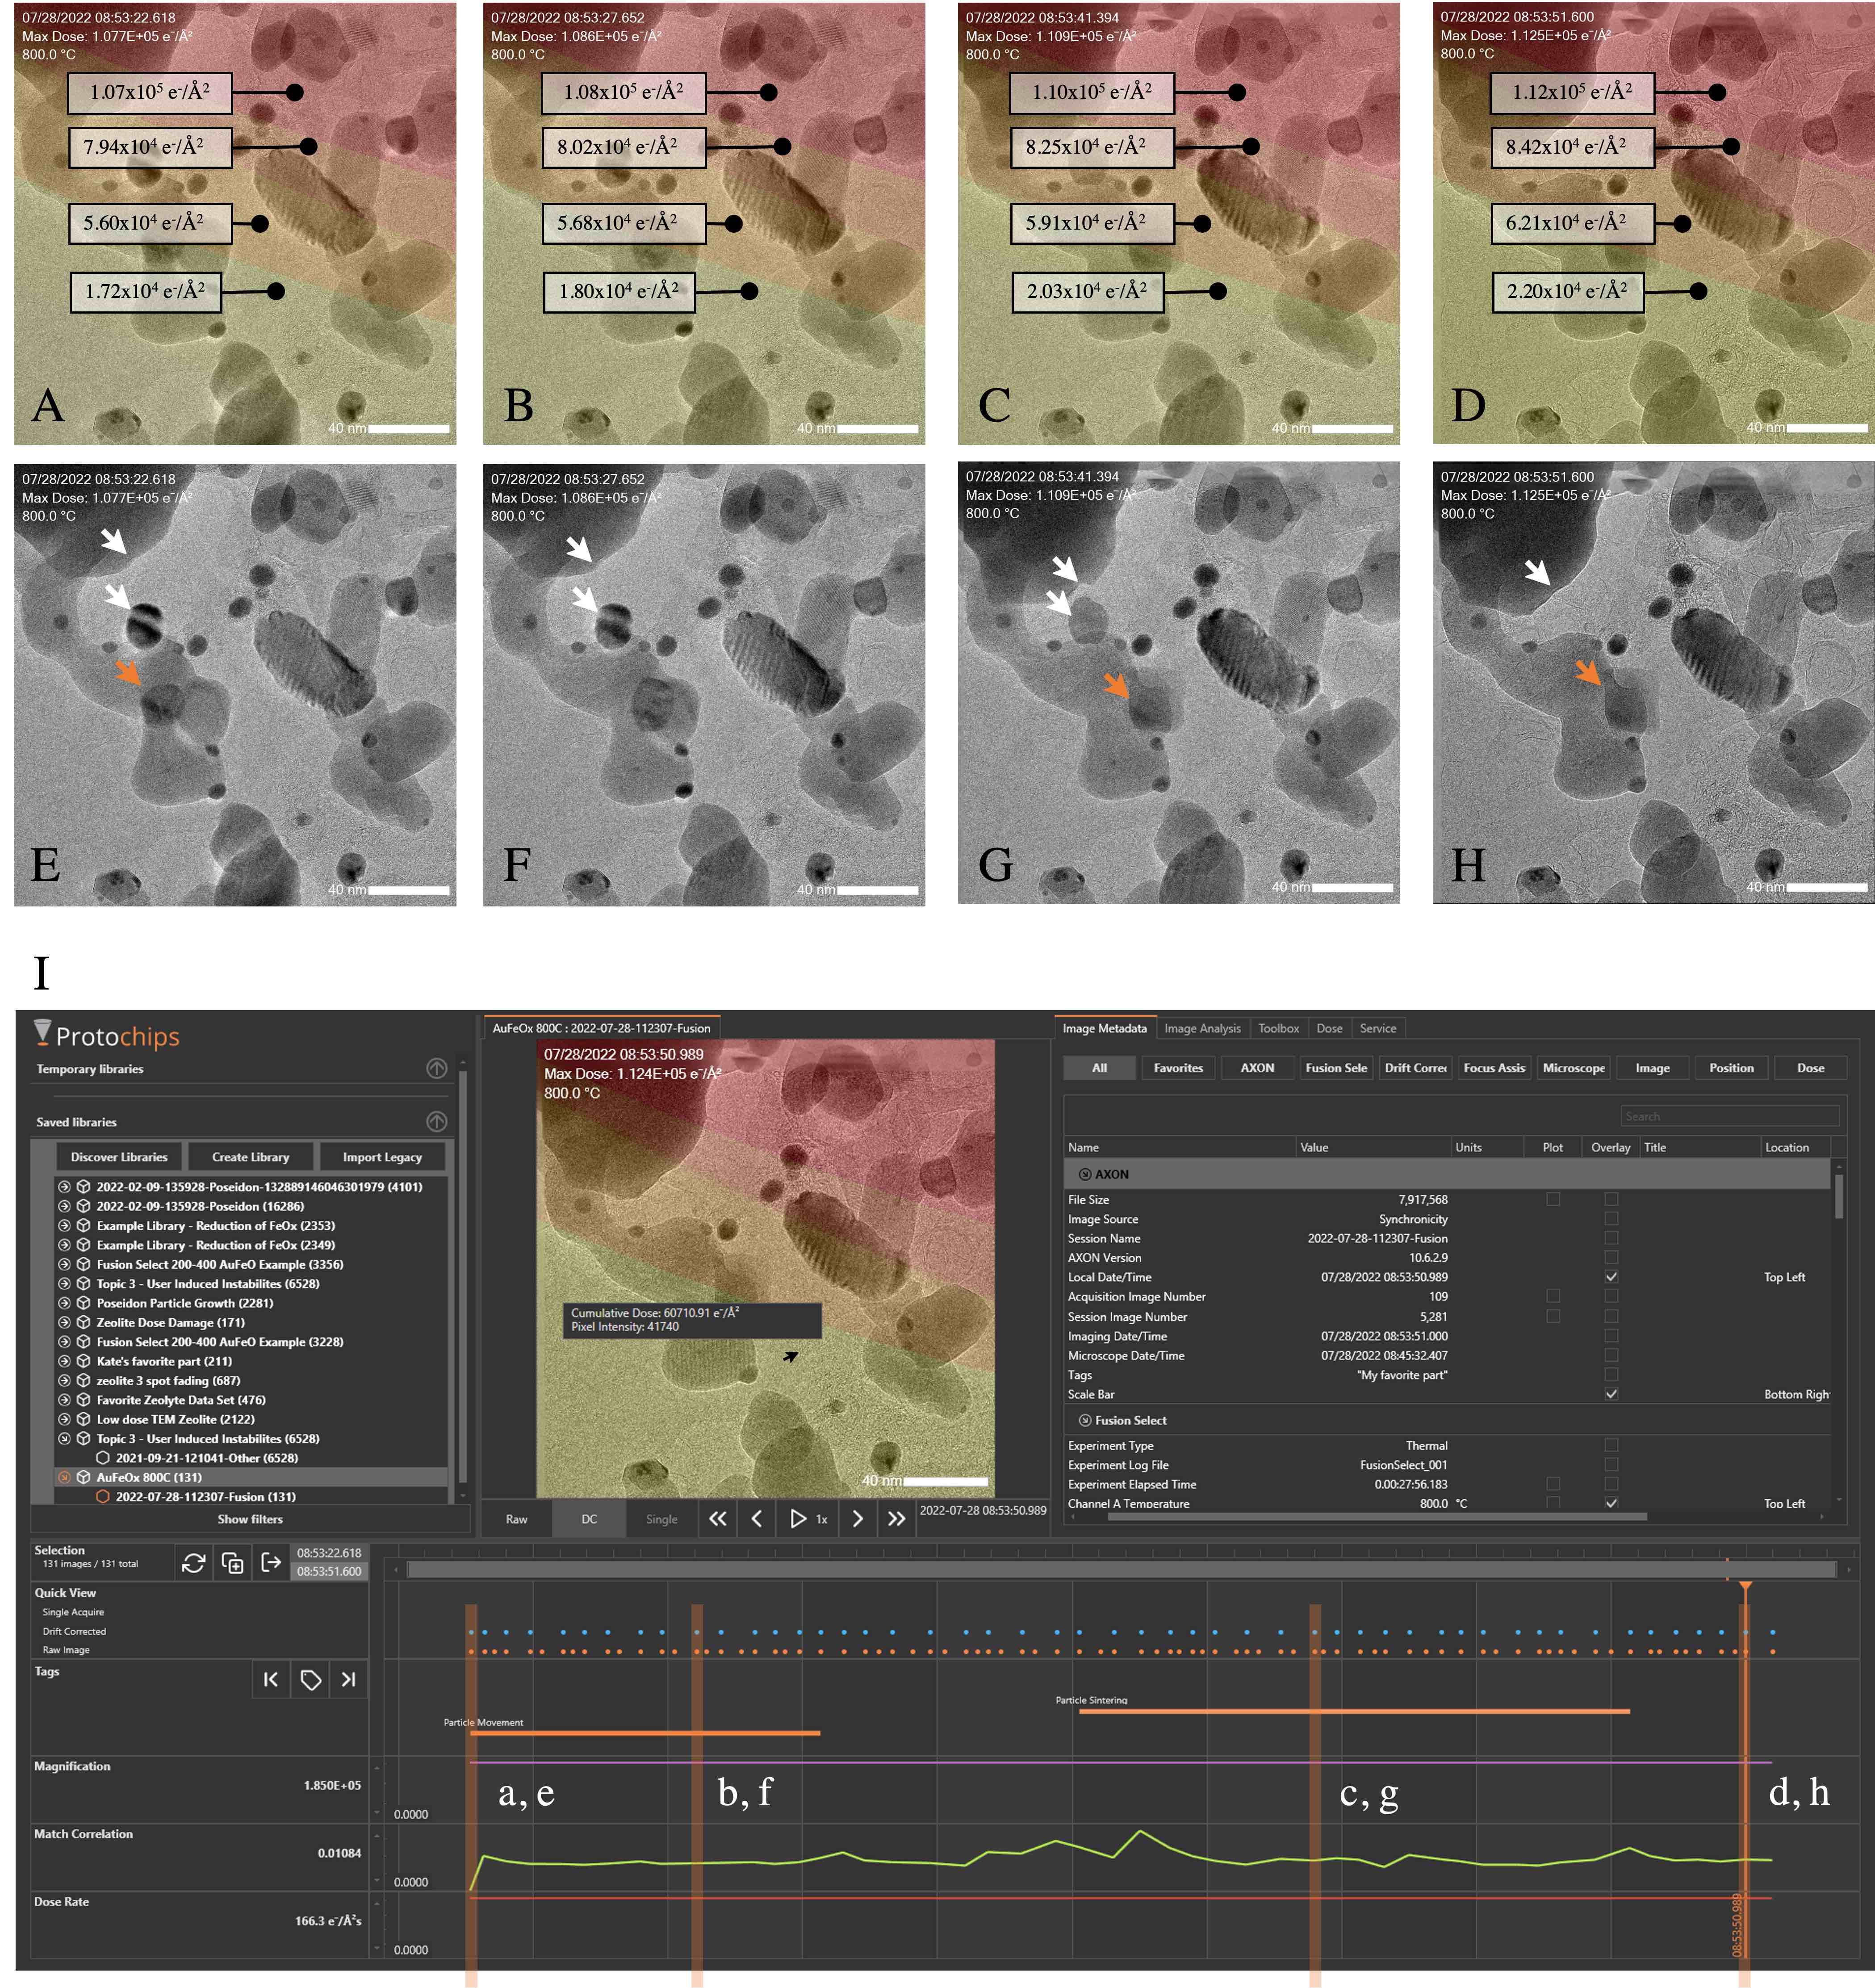
AXON Synchronicity aligns the images and metadata produced during an experiment and employs image analysis algorithms to calculate variables between successive images. This allows it to apply adaptive, intelligent algorithms to trigger microscope commands to center and track moving or morphologically evolving structures. These images and their associated metadata are automatically organized into a timeline format, and user-triggered changes, such as adjustments to beam conditions, detector acquisitions or in-situ stimuli, are updated in real-time. An example of this organization is shown in Figure 1I. This real-time access to all the parameters of an experiment, when combined with machine-vision programs, enables a new level of performance and decision, both during the experiment and when analyzing the results. For example, a dose calibration workflow has been developed which relies on a dedicated Faraday cup calibration holder and utilizes an automated machine-vision workflow to index the beam current for each combination of lens conditions. During an experiment, AXON software monitors the imaging conditions and accumulated dose by tracking the beam’s position on the sample and records the cumulative dose history against sample features (Figure 1A-E) [6].
AXON Studio, is a free-to-use offline analysis software designed to view, filter, and share the data sets generated from AXON Synchronicity. Identical datasets can be viewed and analyzed independently by multiple parties, without the loss of precious metadata associated with the individual images. In addition to viewing the entire experimental timeline, sections of data can be easily filtered and re-packaged into smaller subsets and shared or exported in a variety of formats that facilitate collaborative work, simplify publishing, and enable better, data-driven decision making.
Figure 1: AXON Synchronicity aligns metadata and images produced during an experiment and applies machine-vision algorithms to track and stabilize dynamically evolving samples. (A-E) Images of a nanocatalyst sample (Au/FeOx) at 800C taken at different time points. Dose tracking is shown as a color map, with red indicating regions of high cumulative dose exposure and yellow indicating regions of lower cumulative dose exposure. Highlighting an individual pixel will indicate the cumulative dose for that pixel. (E-H) The same images as highlighted in A-D without the dose overlay. White arrows indicate two particles that merge during the experiment and the orange arrow indicates the trajectory of a moving gold particle. (I) Example of the AXON Synchronicity timeline for the image series shown in A-H. Metadata may be plotted, and the image series can be scrolled through – updating the TEM image shown. The orange vertical bars indicate the image time points of A-H on the timeline.
- References
(1) Topsøe, H. Developments in Operando Studies and in Situ Characterization of Heterogeneous Catalysts. J. Catal. 2003, 216 (1), 155–164. https://doi.org/10.1016/S0021-9517(02)00133-1.
(2) Kelly, D. F.; DiCecco, L.-A.; Jonaid, G. M.; Dearnaley, W. J.; Spilman, M. S.; Gray, J. L.; Dressel-Dukes, M. J. Liquid-EM Goes Viral – Visualizing Structure and Dynamics. Curr. Opin. Struct. Biol. 2022, 75, 102426. https://doi.org/10.1016/j.sbi.2022.102426.
(3) Thomas, J. M.; Leary, R. K.; Eggeman, A. S.; Midgley, P. A. The Rapidly Changing Face of Electron Microscopy. Chem. Phys. Lett. 2015, 631–632, 103–113. https://doi.org/10.1016/j.cplett.2015.04.048.
(4) Zheng, H.; Lu, X.; He, K. In Situ Transmission Electron Microscopy and Artificial Intelligence Enabled Data Analytics for Energy Materials. J. Energy Chem. 2022, 68, 454–493. https://doi.org/10.1016/j.jechem.2021.12.001.
(5) Spurgeon, S. R.; Ophus, C.; Jones, L.; Petford-Long, A.; Kalinin, S. V.; Olszta, M. J.; Dunin-Borkowski, R. E.; Salmon, N.; Hattar, K.; Yang, W.-C. D.; Sharma, R.; Du, Y.; Chiaramonti, A.; Zheng, H.; Buck, E. C.; Kovarik, L.; Penn, R. L.; Li, D.; Zhang, X.; Murayama, M.; Taheri, M. L. Towards Data-Driven next-Generation Transmission Electron Microscopy. Nat. Mater. 2021, 20 (3), 274–279. https://doi.org/10.1038/s41563-020-00833-z.
(6) Damiano, J.; Walden, S.; Franks, A.; Marusak, K.; Larson, B.; Coy, M.; Nackashi, D. AXON Dose: A Solution for Measuring and Managing Electron Dose in the TEM. Microsc. Today 2022, 30 (4), 22–25. https://doi.org/10.1017/S1551929522000840.