Using transmission electron microscopy to monitor hydration of theophylline
- Abstract number
- 255
- Presentation Form
- Submitted Talk
- DOI
- 10.22443/rms.mmc2021.255
- Corresponding Email
- [email protected]
- Session
- Stream 1: EMAG - Soft and Hybrid Materials
- Authors
- Ms Natalia Koniuch (1), Dr Mark S'ari (1), Dr Nicole Hondow (1), Prof Rik Drummond-Brydson (1), Dr Andy Brown (1)
- Affiliations
-
1. University of Leeds
- Keywords
theophylline, low dose TEM, hydration, polymorphs
- Abstract text
Identifying and understanding phase transformations of organic drug compounds, especially when exposed to water during processing or storage, is of great importance to the pharmaceutical industry. Hydrated forms of active pharmaceutical ingredients can alter the dissolution profile of a drug but limiting hydration requires identification and understanding of reaction pathways so that improved processing, formulation, and storage can be developed. Here, hydration of the model compound theophylline (an example of a channel hydrate), will be investigated by transmission electron microscopy.
Anhydrous theophylline (form II) rapidly transforms to the monohydrated form (M) when placed in contact with water at ambient temperature. This has negative consequences on therapeutic applications as it leads to lower dissolution rates and lower bioavailability. In addition to environmental and processing conditions (i.e. humidity, temperature, pressure), other factors such as defects and impurities in the primary crystalline structure as well as particle size can affect this phase transformation. Standard solid-state analytical techniques have a limit of sensitivity to the presence of trace amounts of phases such as M and are unable to characterise crystal defects. Transmission electron microscopy (TEM) observe changes in atomic structure and phase distribution of theophylline but low electron dose techniques and specifically knowledge of the characteristic or critical electron fluence are required [1,2]. Analysis within the electron dose budget for minimal specimen alteration has the potential to improve understanding of phase transformations in theophylline and other channel hydrates.
In this work, a FEI Titan3 Themis G2 operated at 300 kV and equipped with a monochromator and a Gatan OneView camera was used to examine crystals of theophylline. Samples of theophylline, form II, were prepared by evaporative crystallisation from a solution in nitromethane directly on to TEM continuous carbon support grids. Samples were tested under the following conditions: (i) immediately after crystallization, (ii) after contact with water for 10 minutes and then rapidly plunge freezing into liquid ethane, thereby preserving the absorbed water, (iii) after storing the sample for 3 weeks under uncontrolled relative humidity (RH) conditions. Bright-field (BF-TEM) images, selected area electron diffraction patterns (SAED) and lattice imaging were acquired in low dose condition to not exceed the critical fluence for theophylline of 36.3 ± 8 e-/Å2 at 300 keV [1].
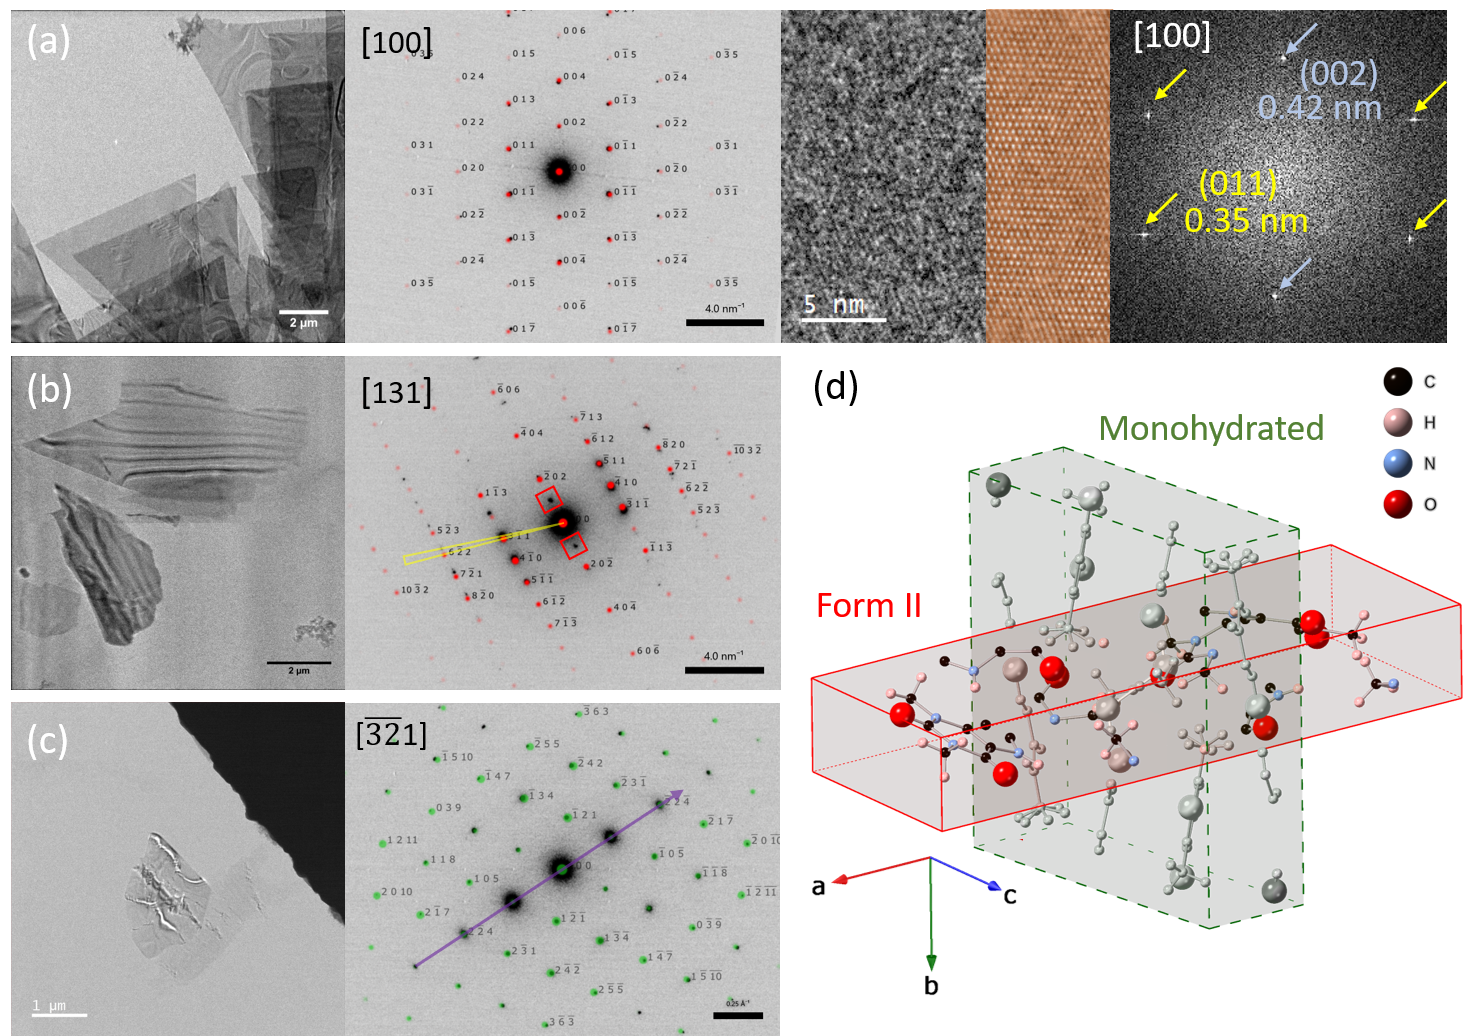
Imaging of bend contours in theophylline crystals and corresponding selected area electron diffraction (SAED) patterns between samples, indicate changes in crystal structure after being exposed to water contact and uncontrolled RH (Fig. 1). Fig. 1a shows a region of large, triangular flat plates of form II analysed immediately after crystallisation. Diffraction patterns index to theophylline form II orientated along the [100] zone axis and lattice fringes in CTEM were acquired at a total electron fluence of 31 e-/Å2 and an image pixel size of 0.076 nm. For the sample left in direct contact with water (Fig 1b) the theophylline has lost the original triangular platelet morphology, however, the particle edges are still facetted, and bands of diffraction contrast run evenly across the crystals suggesting a phase transformation. SAED patterns do not index to the M form however the crystals lie in a different orientation compared to the initial anhydrous sample, i.e. [131] and do not perfectly index to form II because of systematic absences (red boxes inset in the SAED of Fig. 1b) and because the family of spots from the {31-1} planes deviate from the expected position by a few degrees. Further diffraction analysis and scanning electron diffraction will be used to assess this potential phase transformation and the origin of the regular bands of diffraction contrast seen in the images. Different results were obtained with the sample exposed to uncontrolled RH (Fig. 1c). This sample also has many crystals of altered morphology compared to the anhydrous form. SAED patterns from this sample index to the M form, however, a characteristic row of high intensity spots indicates significant structural changes in the (11-2) plane. Further work will aim to repeat this on the hydrated crystals to analyse the presence and distribution of defects in these partially transformed crystals.
This work will provide a better understanding of phase transformations during hydration of theophylline, ultimately identifying how they proceed at the atomic scale. The approach will be translated to other pharmaceutical and beam-sensitive samples to understand other hydration and dehydration mechanisms.
Figure 1 BF-TEM image of theophylline recrystallized from nitromethane with corresponding SAED patterns and simulated patterns overlaid for samples prepared and analysed: (a) immediately after crystallization and indexed to form II, (b) after contact with water for 10 minutes and indexed to form II, (c) after storing the sample for 3 weeks under uncontrolled relative humidity conditions and indexed to form M. Red boxes in (b) indicate forbidden reflections, yellow triangle indicates deviation from the expected position of reflections from the family of {31-1} planes of form II. Purple line in (c) highlights a characteristic row of high intensity spots indicate significant structural changes in form M. Additionally in (a) lattice imaging (with the inset of the inverse of the masked FFT of the image) taken from the tip of a theophylline form II plate with the corresponding FFT (showing d-spacings of 0.35 ± 0.01 nm and 0.42 ± 0.01 nm) collected with a total electron fluence of 31 e-/A2 at a magnification of 115kX; (d) simulated crystal unit cell of theophylline form II and monohydrated (form M) orientated in the same molecular orientation.
- References
[1] J Cattle et al., J. Phys.: Conf. Ser. (2015), 644.
[2] M S'ari et al., Mol. Pharm. 15 (2018), 5114-5123.