Ultrafast nanoimaging of the order parameter in a structural phase transition
- Abstract number
- 91
- Presentation Form
- Poster Flash Talk + Poster
- Corresponding Email
- [email protected]
- Session
- Stream 2: EMAG - Instrumentation Development (incl Detector technology)
- Authors
- Till Domröse (1), Thomas Danz (1), Prof. Dr. Claus Ropers (1, 2)
- Affiliations
-
1. 4th Physical Institute – Solids and Nanostructures, University of Göttingen
2. Max Planck Institute for Biophysical Chemistry
- Keywords
UTEM, Ultrafast, Transmission Electron Microscopy, Charge-density wave, Correlated materials, phase transition, 1T-TaS2, van-der-Waals material, Transition-metal dichalcogenides
- Abstract text
Optical control strategies and modification of physical material properties induced by optical stimuli have a profound impact on current and future technological applications. Microscopically, the functionality of devices usually arises from the interplay of various degrees of freedom on nanometre length and femto- to picosecond time scales. However, drastic changes of material properties are often encoded in low-intensity signals, calling for new experimental means to explicitly access order parameters in out-of-equilibrium scenarios.
Ultrafast transmission electron microscopy (UTEM) promises insights into ultrafast processes in heterogeneous structures by means of imaging, diffraction, and spectroscopy [1]. In the Göttingen UTEM, we use ultrashort electron pulses generated by linear photoemission from a nanometric tip emitter to investigate out-of-equilibrium dynamics in laser pump/electron probe experiments [2]. The exceptional beam properties allow for a versatile use of the Göttingen UTEM, as demonstrated in recent years [3-10].
A particularly intriguing application of UTEM is the investigation of structural phase transitions such as in the prototypical charge-density wave (CDW) material 1T-TaS2, which have been studied in various ultrafast diffraction experiments in the past [11-14]. The structural state of this material is encoded into a subtle additional periodic modulation of the crystal structure accompanying CDW formation, constituting various first-order phase transitions ranging from an insulating state at low temperatures to a metallic high-temperature phase [15].
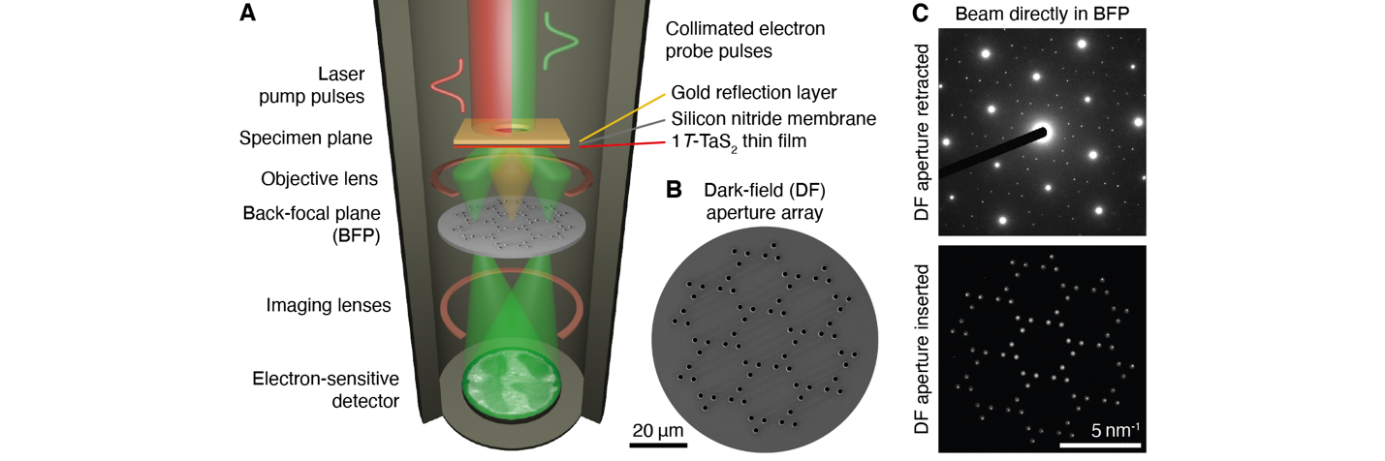
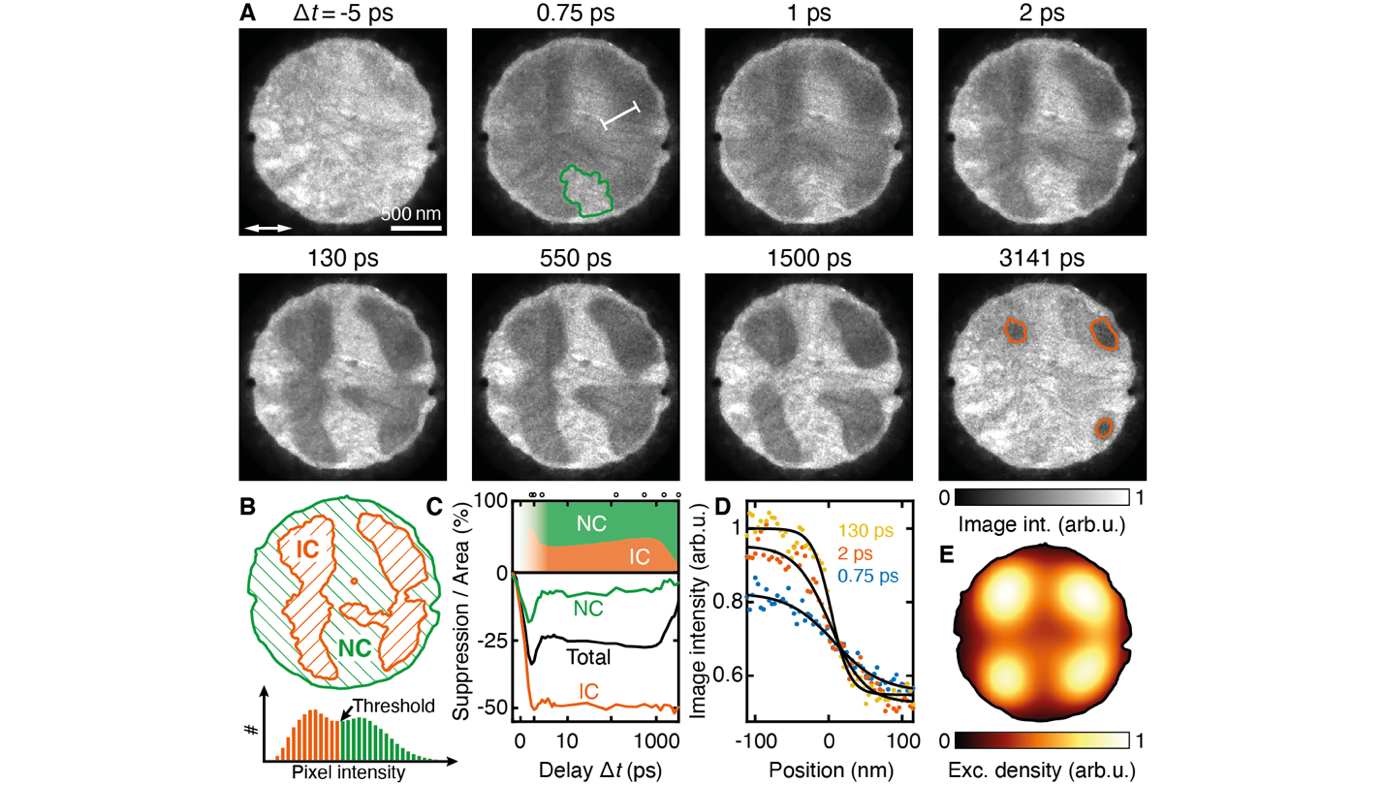
In this work, we demonstrate a new experimental approach to image the structural phase transition from the semi-metallic, nearly commensurate (NC) CDW modification of 1T-TaS2 at room-temperature to the metallic, incommensurate (IC) CDW at higher temperatures in real space with 5-nm spatial and femtosecond temporal resolution (see Fig. 1A for a schematic of the experimental setup) [16]. By introducing a specifically tailored dark-field aperture array (Fig. 1B), we gain sensitivity to the local CDW periodicity of the NC CDW phase in the presence of spatially inhomogeneous optical excitation in the 1T-TaS2 thin film [17]. Initially, we witness a global quench of the NC CDW amplitude governed by the local fluence of the optical pump beam, followed by a condensation of IC CDW domains (see Fig. 2A for the resulting micrographs). Specifically, our approach allows us to analyse dynamics in the individual phases via image segmentation (Fig. 2B and C), and, furthermore, provides sensitivity to processes at domain walls, where we observe a sharpening within a few picoseconds (Fig. 2D). Subsequently, the domain pattern evolves on the time scale of thermal diffusion, including an intermediate domain growth prior to the relaxation back to thermal equilibrium after a few nanoseconds.
In contrast, inducing the phase transition by continuous-wave laser excitation allows for a precise characterization of the thermal properties of our sample design. Based on this, we reproduce prominent features in the ultrafast dynamics in time-dependent Ginzburg-Landau simulations, elucidating relaxation pathways and domain wall dynamics
In conclusion, we demonstrate first ultrafast real-space imaging of a structural phase transition on its intrinsic time and length scales via a specifically tailored dark-field approach. Corroborated by a static specimen characterization and time-dependent Ginzburg-Landau simulations, we gain insights into order parameter dynamics at domain walls and thermal transport processes. As our experimental approach is easily transferred to other degrees of freedom in complex materials, we hope to inspire novel types of contrast-enhancement via beam-shaping in ultrafast methodologies.
Figure 1. Dark-field imaging in the ultrafast transmission electron microscope. (A) Experimental setup. Electron (green) and optical pulses (red) are incident close to perpendicular on the specimen. (B) Scanning electron micrograph of the tailored dark-field (DF) aperture array placed in the back-focal plane (BFP) in (A). (C) Electron diffractograms of the 1T-TaS2 thin film at room temperature with the DF aperture array shown in (B) retracted from (top) and inserted into the electron beam path (bottom). Only NC CDW superstructure reflections are transmitted through the aperture array [16].
Figure 2. Ultrafast dark-field domain imaging of charge-density wave dynamics. (A) Ultrafast DF micrographs of transient domain configurations in the 1T-TaS2 film obtained in the laser pump/electron probe scheme (2.6 mJ/cm2 pump fluence, linear pump polarization indicated by white arrow). Pump/probe delay steps were chosen to capture all major stages of the dynamics (see black circles above (C)). (B) Top: Image segmentation at 130 ps delay time. Bottom: The segmentation threshold is determined from the intensity histogram of the full image series within the circular aperture. (C) Top: Area fractions of NC and IC regions after completed phase separation, as determined from the segmented images. Bottom: Average intensity of the image series within the entire aperture (black curve), and average intensity in weakly and strongly pumped regions (green/orange curve; evaluated regions are indicated in (A) using corresponding colors). (D) Exemplary profiles of NC/IC phase boundaries taken on the white line indicated in (A). (E) Spatial profile of the excitation density giving rise to the initial suppression pattern [16].
- References
- A. H. Zewail, Science 328, 187-193 (2010).
- A. Feist et al., Ultramicroscopy 176, 63-73 (2017)
- A. Feist et al., Nature 521, pp. 200-203 (2015).
- K. E. Priebe et al., Nat. Photonics 11, 793-797 (2017).
- A. Feist et al., Struct. Dyn. 5, 014302 (2018).
- N. Rubiano da Silva et al., Phys. Rev. X 8, 031052 (2018).
- N. Bach, T. Domröse, et al., Struct. Dyn. 6, 014301 (2019).
- M. Möller, et al., Commun. Phys. 3, 36 (2020).
- O. Kfir et al., Nature 582, 46-49 (2020).
- A. Feist et al., Phys. Rev. Research 2, 043227 (2020).
- M. Eichberger et al., Nature 468, 799-802 (2010).
- K. Haupt et al., Phys. Rev. Lett. 116, 016402 (2016).
- S. Vogelgesang et al., Nat. Phys. 14, 184-190 (2018).
- A. Zong et al., Sci. Adv. 4, eaau5501 (2018).
- K. Rossnagel, J. Phys. Condens. Matter 23, 213001 (2011).
- Th. Danz, T. Domröse, C. Ropers, Science 371, 371-374 (2021).
- Th. Danz et al., J. Phys. Condens. Matter 28, 356002 (2016).