Tracking 3D cell shape using an OPM platereader
- Abstract number
- 141
- Presentation Form
- Submitted Talk
- DOI
- 10.22443/rms.mmc2021.141
- Corresponding Email
- [email protected]
- Session
- Stream 6 (Frontiers): Lightsheet Microscopy: Development and Application
- Authors
- Dr Nathan Curry (1), Dr Lucas Dent (2), Dr Hugh Sparks (1), Dr Vicky Bousgouni (2), Dr Vincent Maioli (1), Dr Sunil Kumar (1, 3), Dr Chris Bakal (2), professor Christopher Dunsby (1)
- Affiliations
-
1. Imperial College London
2. The Institute of Cancer Research
3. Francis Crick Institute
- Keywords
OPM, Single objective light sheet, 3D, time lapse, segmentation
- Abstract text
Light sheet fluorescence microscopy (LSFM) is a fast, low phototoxicity, imaging approach. Oblique plane microscopy [1] (OPM) is a variant of LSFM, which allows imaging of more conventionally mounted samples. One example is performing LSFM on multiwell plates [2]. By culturing cells in a 3D collagen matrix, we can image cells in the same well (chemical environment) but distinct physical environments (coverslip proximal and distal). We are further able to track cells in 3D and measure 3D shape.
This technology is a powerful new approach to the study of cell shape and migration, both of which are essential to metastasis in cancer. Here, we have developed a full OPM acquisition and analysis pipeline for investigating and tracking cell shape.
In fixed cells, we investigated the impact of Rho-GTPase regulatory protein knockdowns on cell shape in different physical environments. OPM allowed us to image an average of 200 cells per well across 3 plates (50 wells per plate), taking 90 minutes per plate. The spatial resolution was 0.5×0.5×5 μm3 (FWHM. Building on this work we then imaged live cells in collagen, treated with molecules that inhibit the cell cytoskeleton and cell cycle. We tracked cell shape as a function of time by imaging 30 wells every 5 minutes for 9 hours tracking how drug treatments affect morphological plasticity.
We developed an automated 3D cell segmentation pipeline. We tested the robustness of our segmentation by comparing two segmentation methods (active contour vs. Otsu’s method) and verified that shape changes were not due to the anisotropic PSF or the inherent spatial variation in the PSF due to the divergence of the Gaussian light sheet.
For fixed cells, in control conditions, we identified characteristic 3D shape changes between coverslip proximal and distal cells. We further identified four Rho-GTPase regulatory proteins which change these shapes in at least one of the conditions.
In live cells we identified characteristic cell shapes by k-means clustering on relevant shape features (e.g. volume and protrusivity). We quantified the fraction of cells in each shape for different drug treatments and shape transitions which were up- or down- regulated.
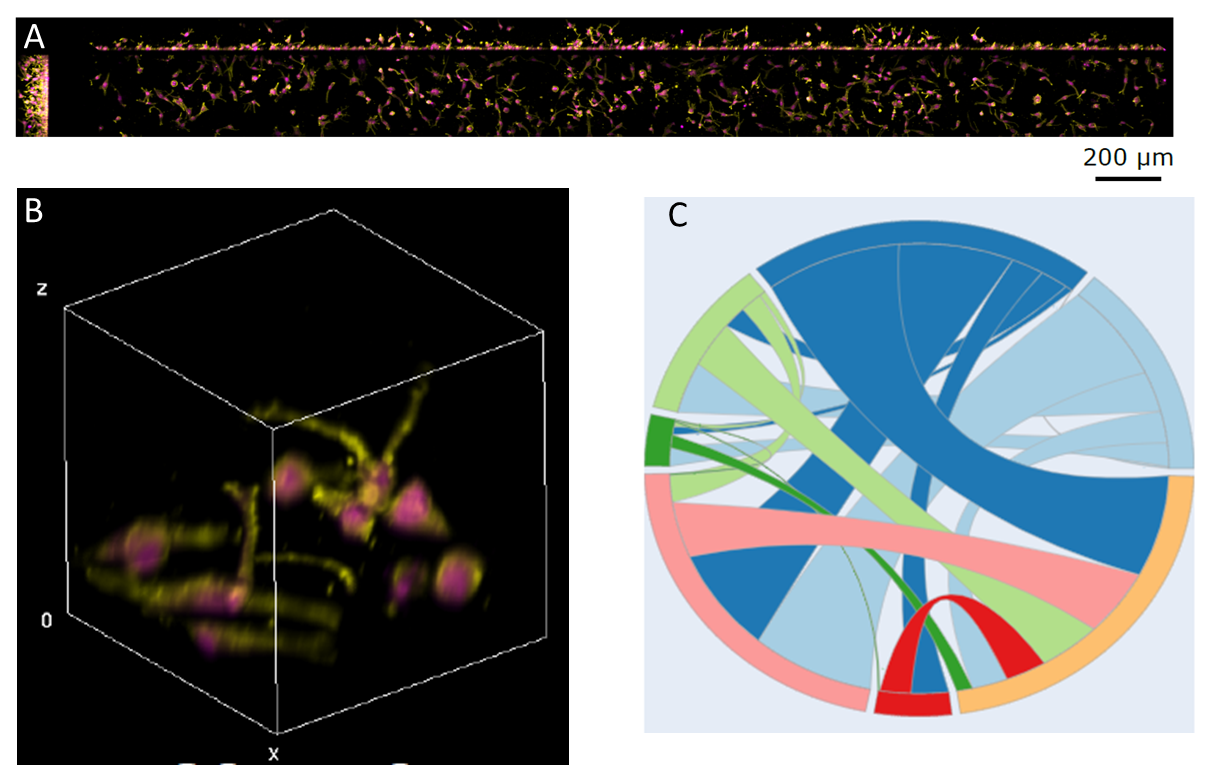
Figure 1: (A) OPM volume from a single well showing ~200 cells. (B) 3D render of a subvolume from (A). (C) Chord diagram for control conditions representing the proportion of cells in each shape cluster and transitions between clusters.
[1] C. Dunsby, Opt. Express 16.25: 20306-20316 (2008)
[2] V. Maioli et al., Sci. Rep. 6:37777 (2016).
- References
[1] C. Dunsby, Opt. Express 16.25: 20306-20316 (2008)
[2] V. Maioli et al., Sci. Rep. 6:37777 (2016).