Perfect Pixel Correlative Capture of Energy Dispersive and Cathodoluminescence Spectroscopy Data from a Chondritic Meteorite
- Abstract number
- 232
- Presentation Form
- Submitted Talk
- Corresponding Email
- [email protected]
- Session
- Stream 1: EMAG - Spectroscopy & Advanced SEM
- Authors
- Dr Jonathan Lee (1), Dr Michael Bertilson (1), Dr David Stowe (1)
- Affiliations
-
1. Gatan, Inc.
- Keywords
Energy dispersive spectroscopy, EDS, cathodoluminescence, CL, meteorite, trace element
- Abstract text
Energy dispersive spectroscopy (EDS) and cathodoluminescence (CL) spectroscopy offer complementary information about the properties of a specimen. We demonstrate the simultaneous high efficiency capture of EDS and CL spectroscopic data with perfect pixel correlation. This allowed for direct comparison of EDS elemental quantification and CL emission spectrum which was used to identify minerals, observe grain boundaries, and map the presence of trace elements in a chondritic meteorite.
Introduction
Quantitative elemental identification and quantification techniques can reveal much about materials, however, lack the ability to detect intra-material grain boundaries, determine material structure, or reveal trace elements. Meanwhile, luminescence techniques offer complementary information giving a fuller sample analysis. We present a methodology for simultaneous capture of EDS and CL spectroscopy data allowing for perfect pixel correlation. This method is demonstrated on a chondritic meteorite discovered in Antarctica – Miller region 090010 – containing calcium-aluminum inclusions (CAIs), revealing grain boundaries in corundum and trace elements Fe and Sm.
Experiment
The specimen analyzed in this study was a chondritic meteorite discovered in Antarctica which was found to contain CAIs. The CL data was captured using a Gatan Monarc® Pro cathodoluminescence system (model 450.P.WAR) and an Octane Elite Energy Dispersive Spectroscopy detector attached to an FE-SEM. The specimen was scanned using an SEM with acceleration voltage of 10 kV across a 130 μm x 130 μm square region consisting of 375 x 375 pixels. The EDS data was captured from 0 – 10 keV with 2048 channels each at a bandwidth of ~5 eV. The CL spectroscopic data revealed the emission as a function of wavelength in 670 wavelength segments from 367 – 783 nm (spectral resolution ~0.62nm). Efficient data acquisition of both CL and EDS signals was enabled by unblocking the optical path to both detectors. The EDS and CL signals were captured at the same time allowing for perfect pixel correlation between the EDS and CL data.
Results and Discussion
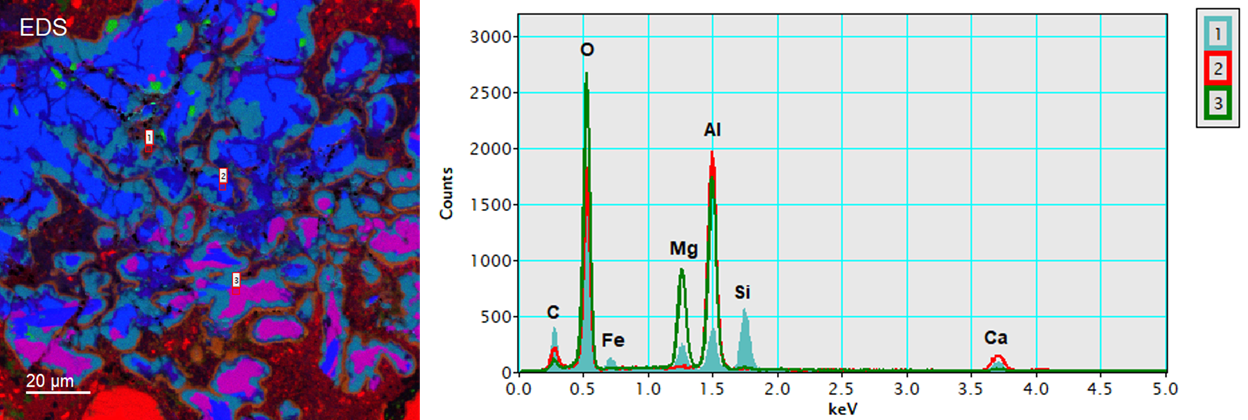
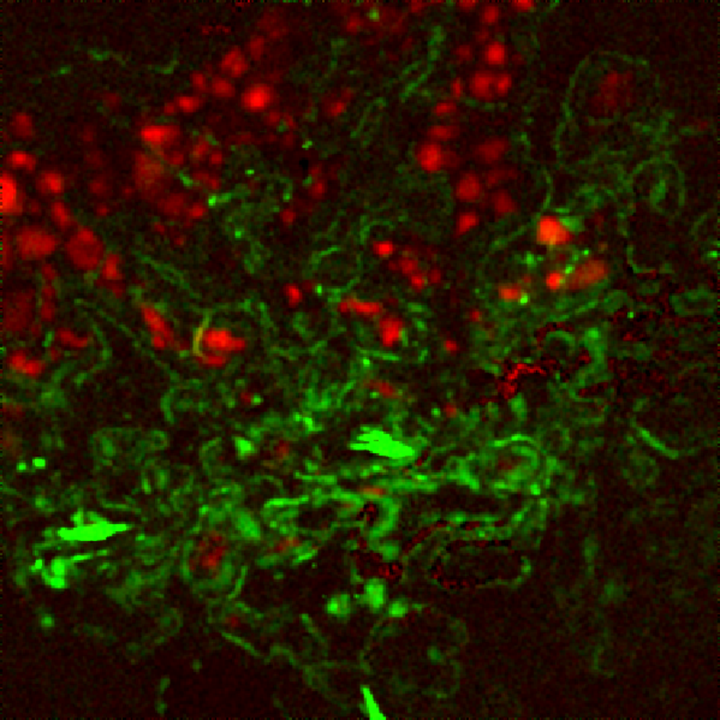
The elemental quantification from EDS was combined with CL spectroscopy to identify the minerals being observed at the same spatial coordinates. In addition to Mg, Ca, and Al, the EDS spectrum image detected other elements, some in high abundance like O and Si, and others which were less abundant, including Fe, C, Ti, and Na. Meanwhile, the CL spectral data revealed the presence of spinel with Cr3+ characteristic peaks at 680, 691, 704, 713, and 723 nm (see Figure 1); and grain boundaries in corundum at 580 nm (see Figure 3). CL emission peaks for trace elements were observed in the spectrum for corundum at 460 nm corresponding to Fe3+[1], and at 603 nm in apatite corresponding to Sm3+[2]. By observing the difference of the peak intensities at 460 and 603 against the surrounding spectral intensity, trace element maps were generated (Figure 4).
Conclusions
CL and EDS were captured simultaneously allowing for perfect pixel correlation between the techniques. Elemental quantification was completed by EDS while grain boundaries and trace elemental maps were identified using CL. This simultaneous capture presents as a distinct advantage over utilization of either technique in isolation. EDS and CL data complement one another to give a more complete sample analysis including elemental quantification and trace element information.
Figure 1. (left) True color representation of the CL spectrum image (color) overlaid with SE image (gray), and (right) extracted CL spectra from points 1 (aqua fill), 2 (red), and 3 (green).
Figure 2. (left) Elemental quantity maps extracted from the EDS spectrum image corresponding to aluminum (blue), calcium (green), and magnesium (red); and (right) extracted EDS spectra from points 1 (aqua fill), 2 (red), and 3 (green). Points 1, 2, and 3 are the same locations as in Figure 1.

Figure 3. (left) Bandpass CL image displaying 580 ± 20 nm and (right) colorized EDS map for Al (blue), Ca (green), and Mg (red).
Figure 4. Extraction of CL trace elements (Fe in corundum) found at 460 nm (red) and (Sm in apatite) 605 nm (green).
- References
[1] J Mogmued, et al., Journal of Physics: Conference Series 901 012075 (2017).
[2] C.M. MacRae, et al., Microscopy and Microanalysis 18, 1239-1245 (2012).