Comparative analysis of continuous rotation electron diffraction (cRED) data using Bloch-wave simulations.
- Abstract number
- 340
- Presentation Form
- Poster Flash Talk + Poster
- DOI
- 10.22443/rms.mmc2021.340
- Corresponding Email
- [email protected]
- Session
- Stream 2: EMAG - Electron Crystallography and Diffraction
- Authors
- Mr Anton Cleverley (1), Mr Yani Carter (1), Mr William Roberts (1), Professor Richard Beanland (1)
- Affiliations
-
1. University of Warwick
- Keywords
Electron Diffraction
Structure Solution
Bloch-Wave Simulation
Silicon
PETS2.0
Felix
Jana2020- Abstract text
Structure solution using electron diffraction (ED) has growing popularity over the past decade [1] and advances in computer control, detector technology and methodology now makes ED of nanoscale crystals widely accessible [2]. While structural refinement is possible using ED data, and structural parameters can have accuracy approaching that of solutions obtained from neutron or X-ray data [3], the match between calculated and measured intensities is invariably much poorer, manifesting as high R-factors [4]. The origin of this problem is still under investigation, but it has long been appreciated that the advantage of strong electron scattering, which allows nanoscale crystals to be analysed, also results in multiple scattering and dynamical diffraction. Attempts to minimise these effects, e.g. by using precession ED [5] to average intensities, improves matters but does not eliminate the problem.
In convergent beam diffraction, good agreement between dynamically diffracted intensities and experimental data is possible and refinements of crystal structure using full dynamical calculations can give atomic coordinates to a precision of 0.2pm [6]. This suggests that high R-factors are not inevitable in ED data. Here, we use Bloch-wave simulations of convergent beam electron diffraction using the program felix [7] running on a cluster of >100 cores to model dynamical diffraction effects in continuous rotation ED (cRED) data and compare it with experimental cRED data from a silicon crystal in the form of a [110] lamella approximately 80 nm in thickness.
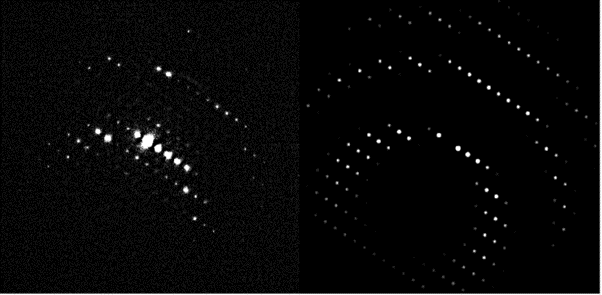
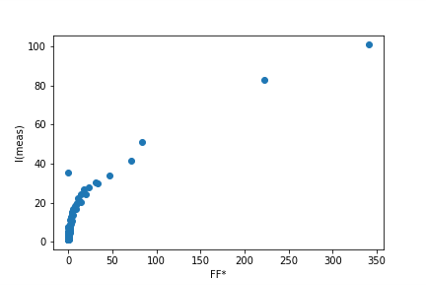
Experimental data was obtained using selected area diffraction on a JEOL 2100 LaB6 transmission electron microscope operating at 200 kV using a Gatan OneView camera running at 75 frames/sec over a 140° range, capturing ~1400 selected area ED (SAED) patterns in <20 seconds producing data up to ~4 reciprocal Ångstroms. The resulting images were then processed using PETS2.0 [8] as a data reduction tool, giving integrated intensities suitable for crystal structure solution. Figure 1 shows a typical experimental SAED pattern (left) and the simulated peak positions determined using PETS2.0 (right). Comparison of integrated experimental intensities I(meas) with calculated kinematical intensities Fhkl.Fhkl*, where Fhkl is the structure factor for reflection hkl and * indicates complex conjugate, show an essentially monotonic but non-linear dependency (Fig. 2).
The PETS2.0 output was used to generate inputs to felix, giving complex amplitudes and intensities for crystals of the correct orientation and a range of thicknesses. We investigate the effects of varying sample thickness, spatial coherence and convergence angle on the expected intensities and optimise the fit between simulation and experiment using a full dynamical calculation.
Figure 1. Left: typical SAED pattern from a silicon sample in the cRED data set. Right: simulated PETS2.0 pattern showing Bragg reflections.
Figure 2. Comparison of measured integrated intensities I(meas) and calculated kinematical intensities Fhkl.Fhkl* for the silicon data in Fig. 1
- References
[1] Midgley, P. A. & Eggeman, A. S. (2015). IUCrJ 2, 126–136;
[2] Mugnaioli, E. (2015). Acta Cryst. B 71, 737–739.
[3] Wolff, A. M., et al. (2020). IUCrJ 7, 306–323.
[4] Grimes, J. M., et al. (2018). Acta Cryst. D 74, 152–166.
[5] Vincent, R. & Midgley, P. A. (1994). Ultramicroscopy 53, 271–282.
[6] Hubert, A. J. M. et al. (2019) Ultramicroscopy 198, 1-9; Beanland, R., et al. (2021). Acta Cryst. A 77, 1–12.
[7] Beanland, R., Evans, K., Ro¨ mer, R. A. & Hubert, A. J. M. (2019). Felix: Bloch wave method diffraction pattern simulation software. https://github.com/RudoRoemer/Felix.
[8] Palatinus, L. et al. (2019) Acta Cryst. B 75, 512-522.
[9] Petricek, V., Dusek, M., Palatinus, L. (2020). JANA2020: Crystallographic Computing System. Institute of Physics of the Czech Academy of Sciences, Prague, Czechoslovakia.